The GPS Datalogger
Before even acquiring the ship, I knew I had to have this bit of gizmology; it automates what I did for a couple of years with the maplets of local kayak jaunts aboard Bubba.
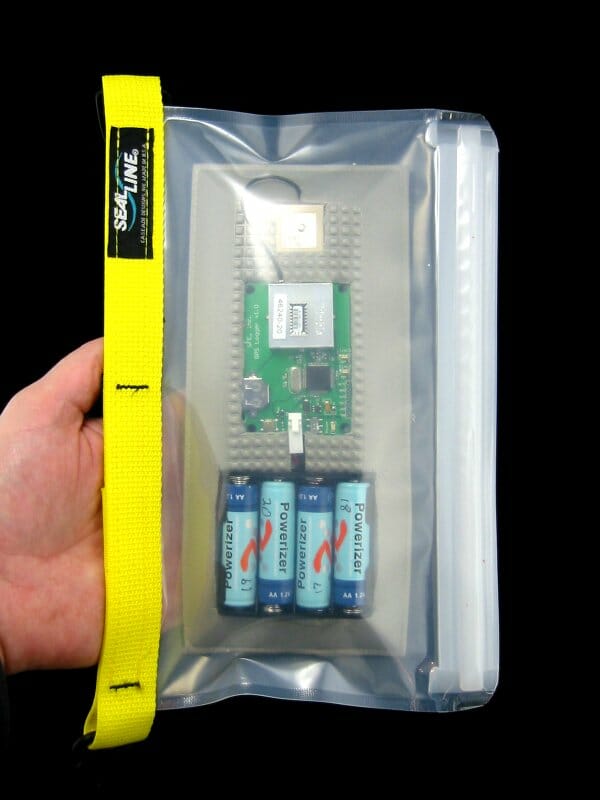
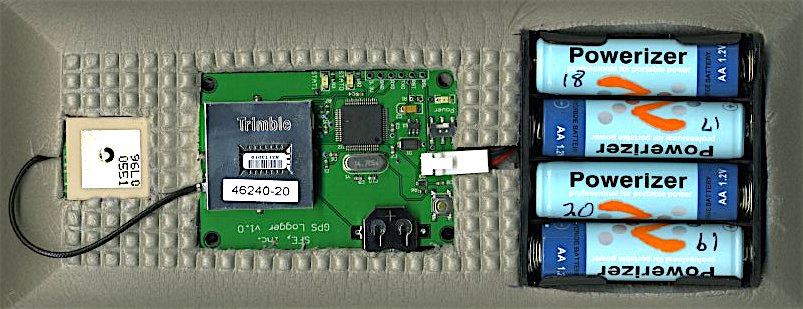
In the photo, you can see my simple and expedient packaging job: I just nestled the hardware into a carved foam insert inside an earlier version of the SealLine Electronic Case. The wee antenna is lost in the glare; below that is the board, which carries the Lassen iQ GPS, an LPC2138 ARM processor, and a socket on the back with a 256 megabyte SD card. The software strips the NMEA sentences to just the basics, and stuffs them into the card… which has enough space for 440 hours of logging! I haven’t checked the power drain yet, but the four 2300 mAH AA NiMH cells should keep it going for quite a while.
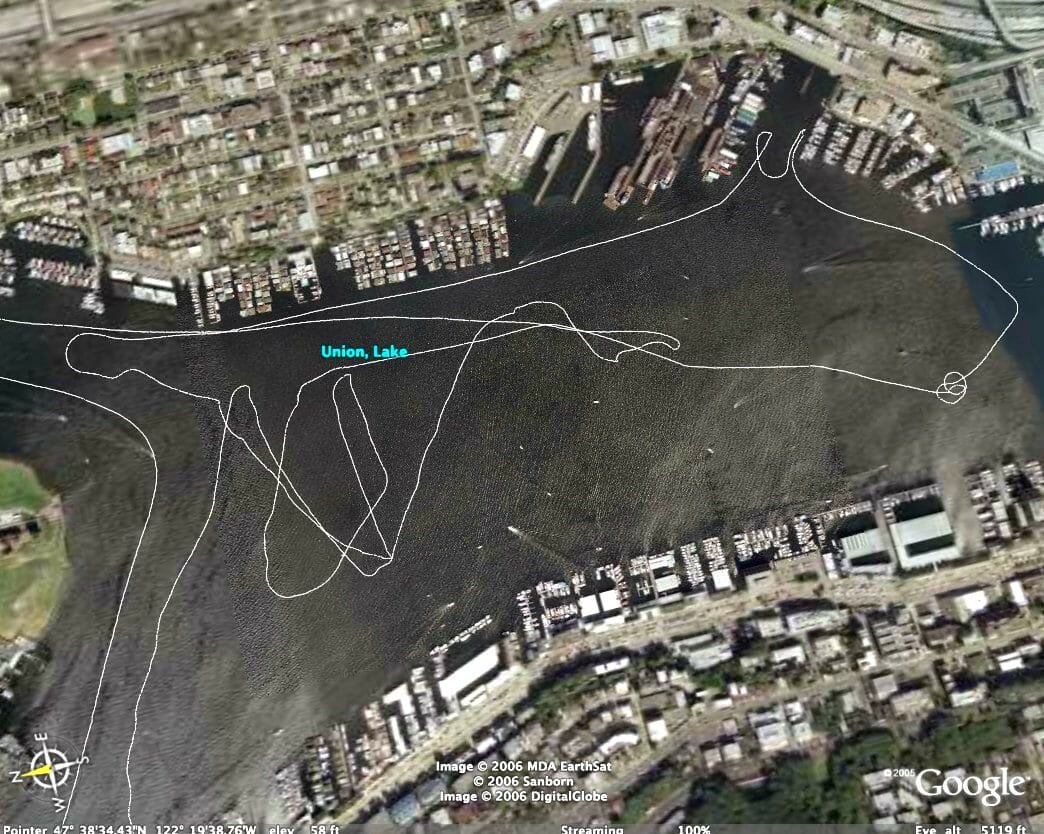
I took this on the first sea trial, bungeed to the propane locker. The LED blinked every second as we played around in the Ship Canal, Lake Union, and Portage Bay. When I got back to the lab, I popped the SD card into my Mac’s USB reader, dropped the collected data into a KML template file, and clicked it to launch Google Earth… with utterly wonderful results!
Here is the sea trial:
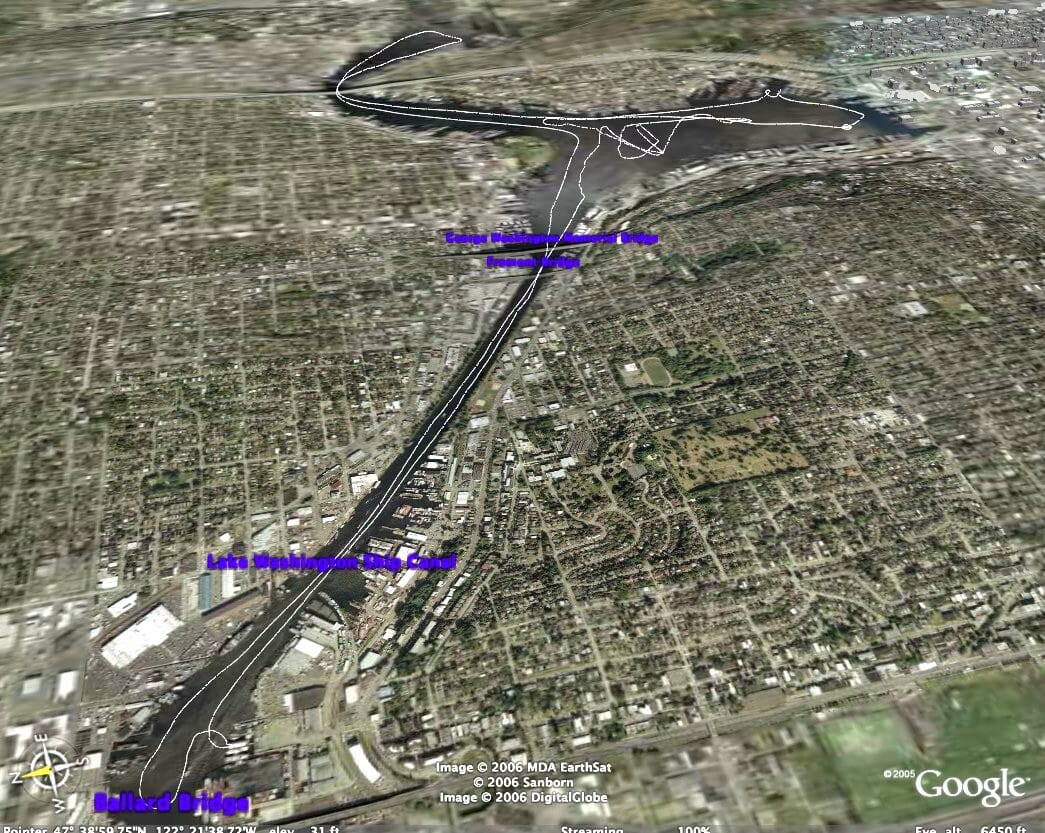
and this is a close-up of our zig-zagging in the Lake to get to know the sails and learn tight maneuvering (the really tight turn in the upper right was done by the broker as he lectured me on prop walk and engine/rudder tricks; the much sloppier one to the left is mine… looks like I need practice):
Ain’t technology wonderful? When this site matures a bit, there will be a browsable archive of track logs and related photos.
Later note: I logged the 621-mile Nomadness adventure in 2008 with this tool… the JPEG at that link is fun to explore if you know these waters.
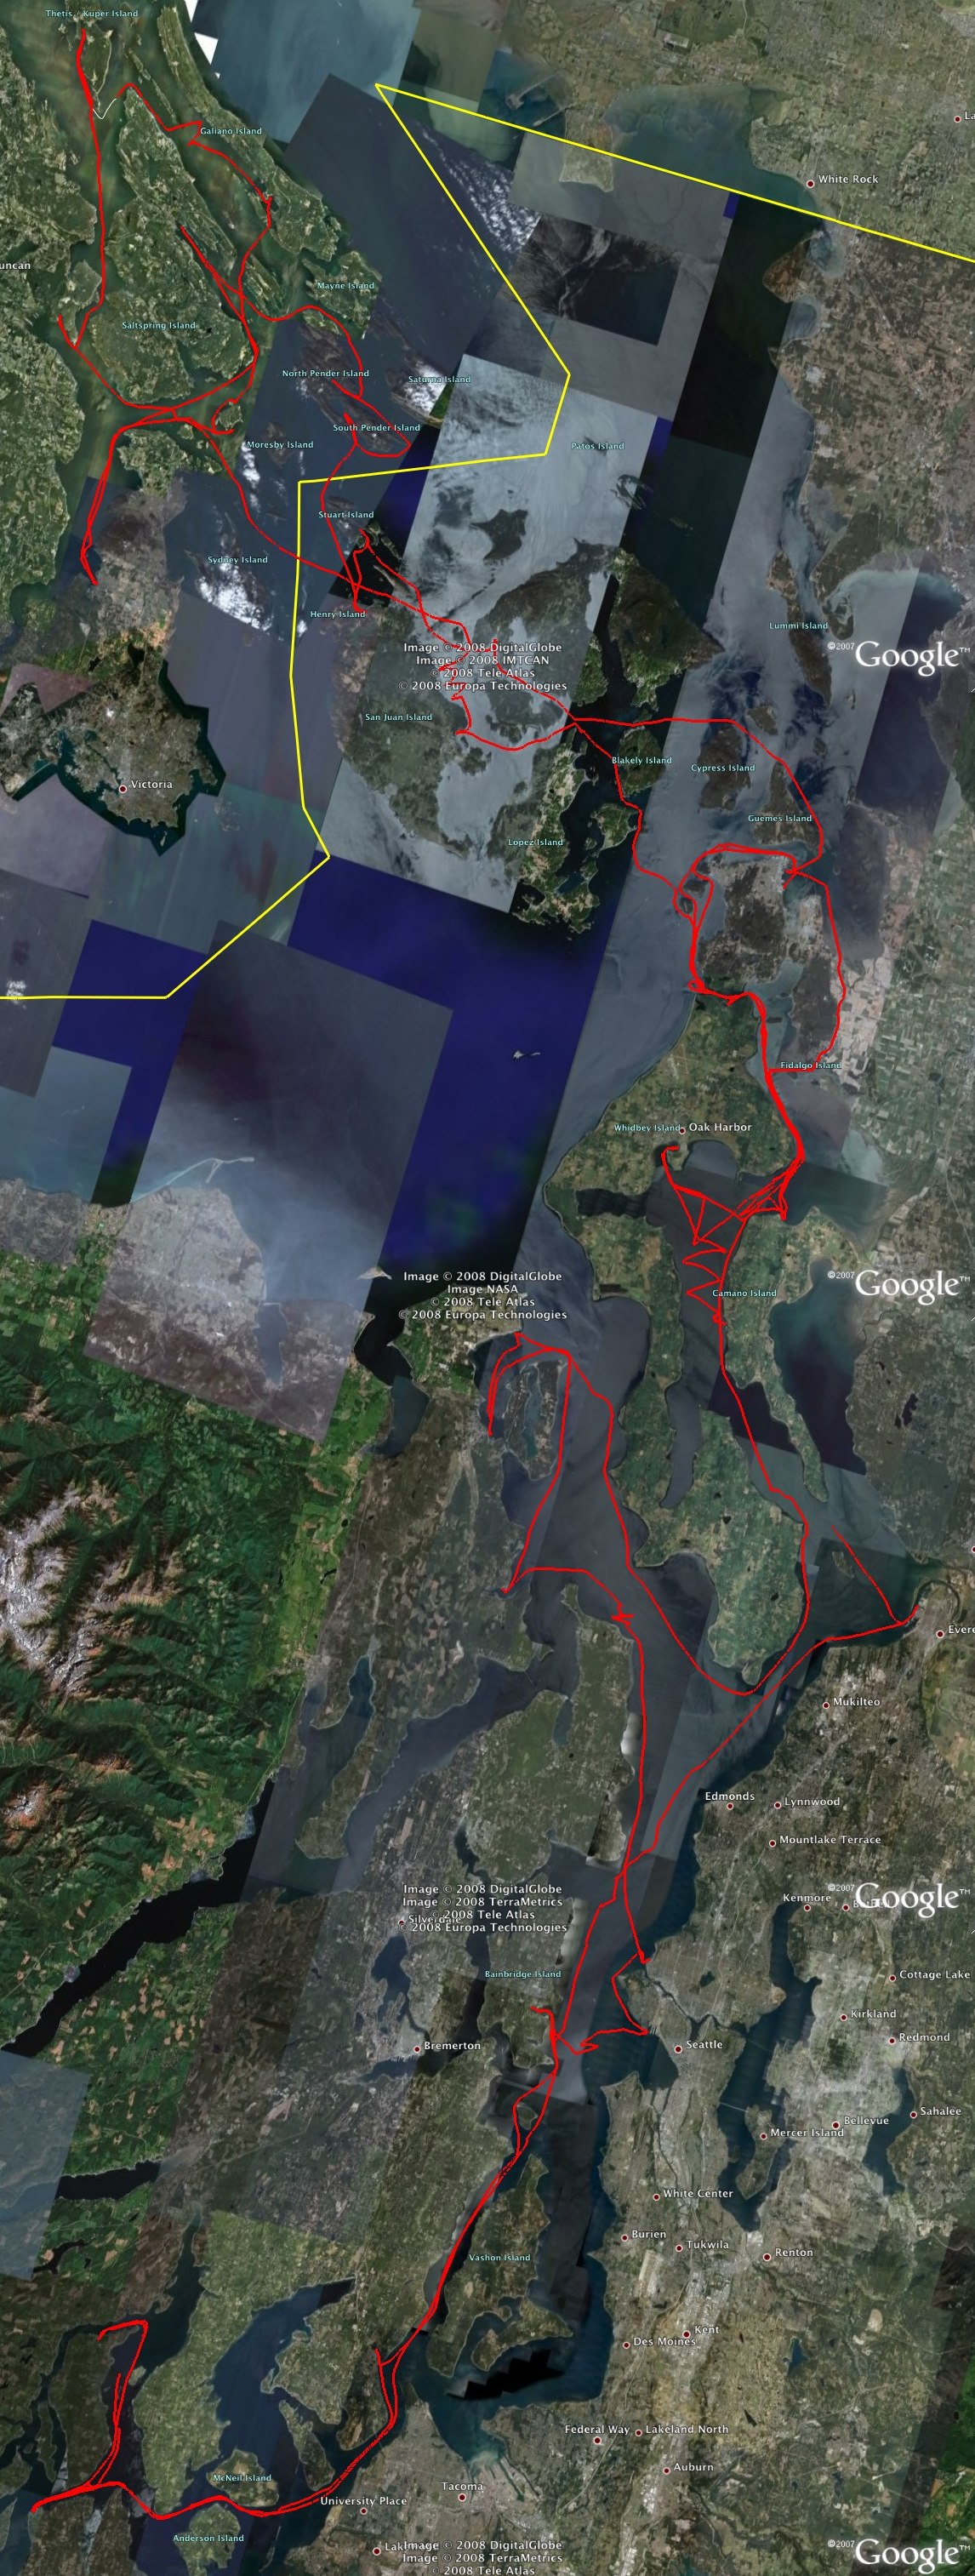